
Before I go too far in depth toward explaining Level 2, there is another important behind-the-scenes component in trading that nobody really talks about. You probably think that the transactions you execute when buying and selling are made directly between you and the next guy, right? WRONG!
You actually don’t sell your shares directly to another person looking to buy those shares. Your shares are sold to a “market maker,” and that person (or firm) sells them instead. It’s a big ol’ complicated process and a hard one to wrap your head around, but these market makers are the ones actually providing the liquidity. They accumulate shares just like anyone else and make their money off the spread between the bid and the ask.
To be honest, I had trouble understanding how market makers work when I first started out, but it’ll make so much more sense the more you pay attention to how stocks behave. You’ll have stocks going up on red candles and stocks flushing with green on the tape. Algo spikes that turn tides with zero explanation. I’m not saying it’s shifty, but I’m not not saying it.
Anyway, Level 2 is best classified as a real-time visual representation of the NASDAQ order book, which lists the bid, the ask and the amount of shares available for both. Your Level 2 window can also be manually set up to show you details like high and low of day, Volume Weighted Average Price (VWAP), percentage change and previous day’s close. For context, let’s take a look at the Level 2 I use through Lightspeed Trader.
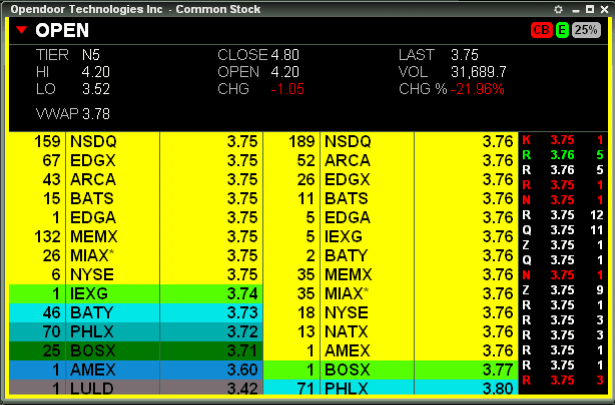
Starting at the top, this Level 2 window tells me the company is Opendoor Technologies and the ticker is OPEN.
“CB” and “E” pertain to the ability to short. “CB” (“circuit breaker”) means the stock is under short-sale restriction, signifying you can only enter your trade by selling on an uptick. “E” means the stock is “easy to borrow” by the broker and does not require you to pay a locate fee. The 25% tells us that you can use up to 4x leverage when purchasing or short selling your shares.
(If the stock did require a locate, you would see a big “L” where the green “E” is. If the stock is not available to short, you would see a “T” for “threshold.” As for the leverage, the percentage will vary between 25%, 50% and 100%, the latter of which implies you cannot use margin to trade said stock.)
The next set of numbers, starting with “Tier N5,” are fully customizable and are technically considered “Level 1.” I have mine set up in a way that is pretty self-explanatory, but I would definitely suggest you keep the day’s volume, percentage change, high and low of day and VWAP listed, but you do you.
Now for the star of the show. My Level 2 is color customized to my liking but the gist is the same across all platforms. The first number, 159, signifies the amount of shares in hundreds (159 = 15,900) on the bid, which, in this case, is $3.75 from Nasdaq (the exchanges — ARCA, BATS, EDGX, etc. — have varying degrees of fees to route your orders, so definitely look into the cheapest option if you plan to take a ton of trades). It should be noted, though, that there are actually 44,900 shares in total on the bid across all exchanges.
On the opposite side are the sell orders, which are displayed in a similar fashion to the side displaying the bids. The example above shows that there are 39,200 shares for sale at $3.76. To the right of that I have my Time and Sales, which shows me all of the transactions taking place as they happen. A red number means the shares were sold on the bid, green were bought on the ask and white simply means the transaction was an even trade.
Keep in mind that most momentum stocks will be moving at a rapid-fire pace, so these numbers may be changing faster than you can read them. Once you get the hang of it, though, you’ll agree trading would be damn near impossible without Level 2 as a tool.
